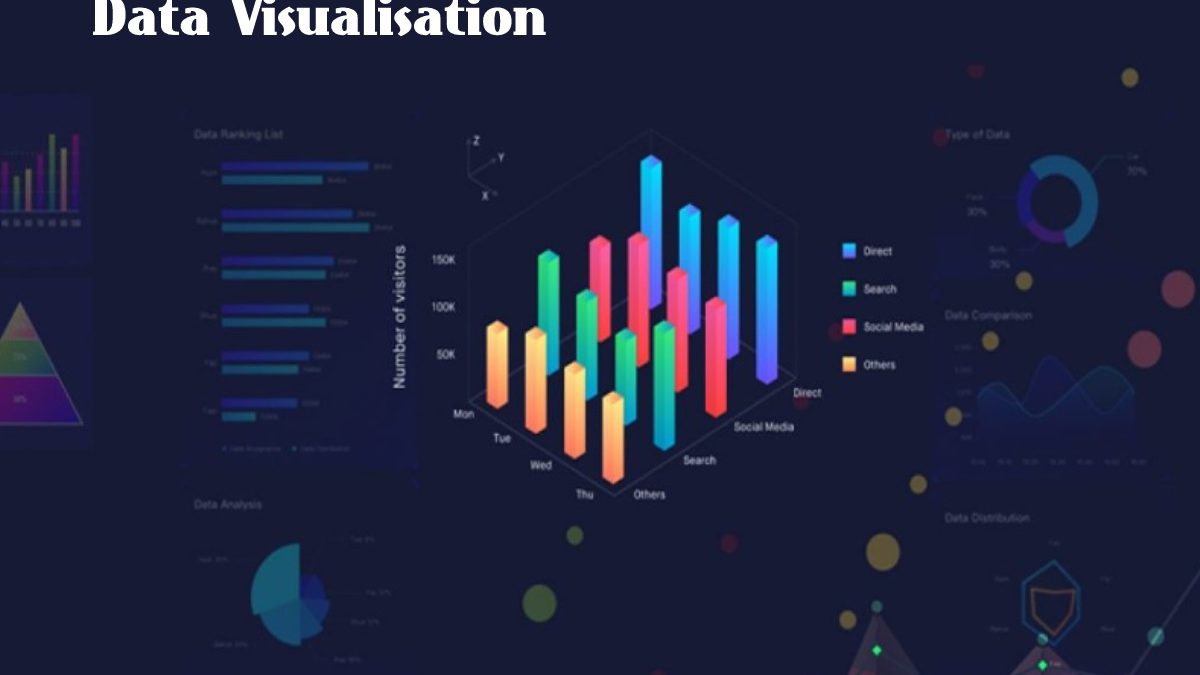
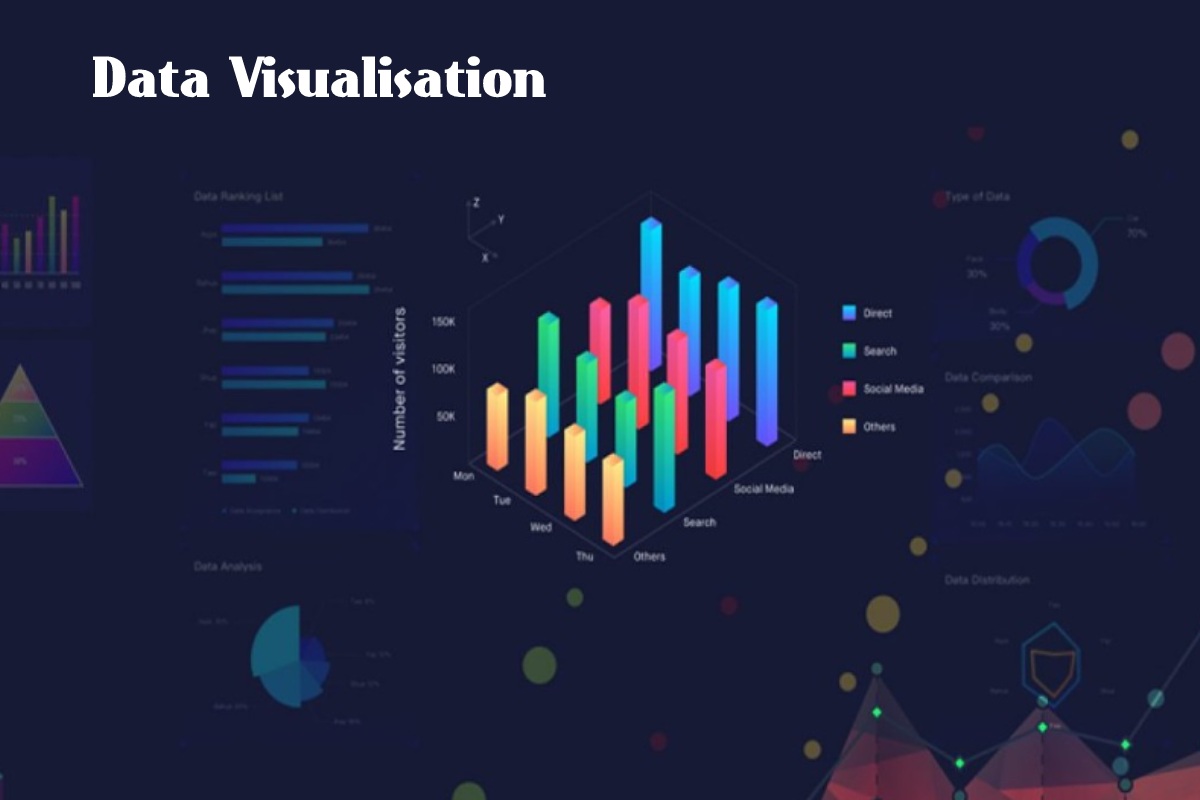
Data Visualisation: With large and small businesses alike now collecting huge amounts of important data and information, we need a mechanism to visualise that data so it analyses and leveraged. Data visualisation tools such as Microsoft Power BI gives businesses and organisations the opportunity to spot trends, patterns and outliers in enormous data sets. By providing it with a visual context via maps or graphs, data visualisation helps us understand what the information means which can aid businesses in making forward-thinking, data-driven decisions.
So what is data visualisation? And why is it important?
Table of Contents
What Is Data Visualisation?
As the name suggests, data visualisation is the practice of putting information into a visual context, like a map or graph, for the purpose of making it easier for the human brain to grasp and draw conclusions. The primary objective of data visualisation is to make it simpler to spot and unearth patterns, trends and outliers in big data sets. The term data visualisation is often used interchangeably with other terms, including information graphics, information visualisation and statistical graphics.
Essentially, data visualisation asserts that after data has been gathered, processed and modelled, it represent in visuals in order to draw conclusions. Data visualisation is also an important component of the larger field of data presentation architecture (DPA), which aims to search, locate, manipulate, format and transmit data as effectively as possible.
Why Is Data Visualisation Important?
Data visualisation offers a fast and efficient approach when conveying information to audiences. In addition, the practice can also assist businesses in determining the variables that influence consumer behaviour. Data visualisation can help to identify areas that require improvement or additional attention such as making data more memorable for stakeholders or figuring out the best times and locations to sell particular products. Data visualisation can even assist in forecasting sales volumes and help to boost both the profitability and productivity of your business.
Other benefits of data visualisation include:
- The ability to find and absorb crucial data quickly, allowing businesses to improve insights and make quicker decisions
- A better understanding of steps that need to takes in order to improve the productivity and efficiency of an organisation
- Maintaining the interest of your target audience for longer with data they can understand
- Easily distributing information and sharing insights with all interested parties
The ability to visualise data is crucial for practically every sector and industry. Teachers can use data visualisation to show test results for students. Computer scientists can use it to enhance artificial intelligence (AI) and executives can use it to communicate with stakeholders. It is crucial for big data projects as well. When businesses require a way to quickly and easily acquire an overview of their data, data visualisation is the solution. In a nutshell, it allows for small and large organisations alike to visualise and easily interpret vast swathes of data and information with ease and efficiency.
For similar reasons, data visualisation tools can be hugely beneficial in advanced analytics. When a data scientist is writing advanced predictive analytics or machine learning (ML) algorithms, data visualisation is crucial in seeing the output for the purpose of tracking outcomes and making sure models are operating as planned. This is due to the fact that sophisticated algorithm visuals are typically simpler to understand than their numerical results.
The Benefits Of Data Visualisation
Data visualisation boasts a number of advantages for large and small businesses alike and is a particularly important component of decision-making and the creation of business strategies. Data visualisation allows modern organisations to comprehend their data in graphical or pictorial forms for the purpose of spotting trends quicker. Other benefits include:
- Correlations in relationships – Finding correlations between independent variable relationships is difficult without data visualisation. However, business decisions can be improved if the organisation can make sense of those independent variables.
- Tracking trends over time – Without the necessary knowledge from the past and the present, it is impossible to forecast future patterns. Trends over time show us where a business has been and where it might be heading.
- React quicker – Data visualisation allows businesses to act and respond to findings quicker, as well as avoid mistakes simply because the data is easier to understand and interpret.
- Analysing customer behaviour – Businesses can get a clearer sense of how potential new consumers behave and respond to various marketing and customer acquisition efforts by looking at the rate and/or how frequently customers make purchases and when.
- Ability to examine the market – Data visualisation uses information from many markets to provide insights into the audiences you should pay attention to and those you should ignore. By presenting this information in various charts and graphs, businesses are able to see the potential inside those markets more clearly.
- Pinpoint areas of improvement – When data visualises, businesses can identify areas within their operations that may require improvement.
What Is The Best Tool?
One popular data visualisation tool for small and large businesses alike is Microsoft Power BI. Power BI is a group of software services, applications and connectors that come together in a single, easily-accessible interface. The software is ideal if you’re looking to transform your unrelated data sources into coherent, engaging visuals and/or interactive insights. Power BI also allows data to be stored in a hybrid data warehouse that is both cloud-based and on-premises for ease of accessibility.
Final Thoughts
So what is data visualisation? And why is it important?
Data visualisation, as the name suggests, is the process of placing information into a visual framework, such as a map or graph, in order to make it simpler to understand and draw conclusions. The primary goal of data visualization is to make it easier to see patterns, trends, and outliers in large data sets.
The basic tenet of data visualisation is that conclusions must be drawn from data that has been visualised before it is properly analysed. Tools such as Microsoft Power BI are important because they allow businesses and organisations to grasp what the information actually means by giving it a visual context via maps or graphs, which can assist large and small businesses alike in making forward-thinking, data-driven decisions.